Owner Satisfaction Ratings: Best and Worst Car Brands Revealed
Our exclusive ratings show which cars have the most satisfied owners, based on survey responses from tens of thousands of car owners
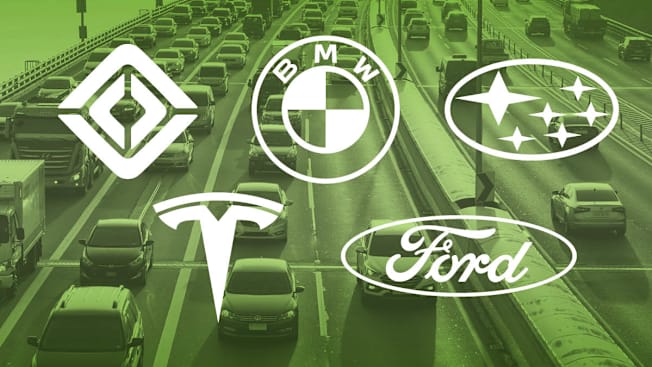
If you’re shopping for a car, it helps to know which vehicles other owners like or loathe. Consumer Reports’ owner satisfaction ratings, which use data from our exclusive member surveys of real car owners, show which brands have met or failed to meet their customers’ expectations in various key areas.
Owner satisfaction ratings for a brand or a particular car sometimes don’t align with reliability ratings for that brand or model, especially for new models. But why would unreliable cars still have happy owners? Partly because new-car warranties frequently cover the repair bills for a problem-prone car.
This year, however, with the average price of new cars exceeding $50,000, buyers may be focusing more on reliability and costs than on flash and performance. In our most recent ratings, six of the 10 most satisfying brands are also on our list of the 10 most reliable brands.
- Owner Satisfaction: Tops in Comfort, Fuel Economy, and More How We Rate Satisfaction
For the third straight year, the EV automaker Rivian and BMW sit at the top of our brand satisfaction list. They’re joined by some of the same automakers who populated last year’s top 10: Tesla, Ford, Genesis, and Lexus.
This year, Subaru has moved up to No. 3 in owner satisfaction, with Toyota, Honda, and Chevrolet rounding out the top 10. Mercedes-Benz was the biggest mover on the list, jumping up nine spots to come in at No. 17.
Tops in Comfort, Fuel Economy, and More
We’ve organized our data to show the brands that owners are most satisfied with in specific areas, including comfort, driving, cabin storage, ownership costs, and in-cabin experience and usability. If you’re shopping for a new car, you can start by considering which qualities you care most about, and use our lists to find out which brands get high scores for them. Then focus your search on brands that did well in those areas and skip those that didn’t.
Remember that owner satisfaction reflects whether a car meets a customer’s expectations. The most satisfying cars aren’t necessarily the best in other categories, and vice versa.
How We Rate Satisfaction
Consumer Reports’ owner satisfaction ratings are based on the results of our 2025 Annual Auto Surveys, which cover about 380,000 vehicles. We averaged data from the 2023 to 2025 model years (plus a few 2026 models), provided a vehicle wasn’t significantly changed over that time. In some cases, ratings might be based on a single model year. The owner satisfaction score is based largely on one specific question: Based on price, performance, reliability, comfort, enjoyment, etc., if given the chance to do it again, would you buy the same vehicle? Ratings and scores for the factors were determined based on the percentage of owners who said they were very satisfied.

